The “Employment Situation Summary” from the Bureau of Labor Statistics may be the most widely scrutinized series of U.S economic data. Unfortunately, the numbers tend to be somewhat noisy and as a result an individual report is sometimes overinterpreted. Such may be the case with the data released last Friday.
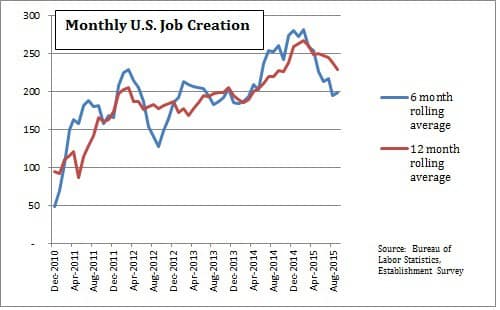
The report was weak, indicating 142,000 jobs created in September—well below the recent trend—and fewer jobs created in July and August than previously reported. As with most economic data, the numbers derive from surveys and are therefore imprecise. The information becomes much more meaningful if you look at six or even twelve months, as shown in the chart below.
As the recovery began in 2010, job creation was pretty weak but picked up steam by late 2011. Except for a dip in mid-2012, probably caused by a temporary surge in gas prices, monthly job creation was in the neighborhood of 200,000 for most of 2012 and 2013. Last year, as homebuilding gained momentum and the drag from cuts in government spending eased, job creation began to surge into the vicinity of 250,000+. That level of employment gains proved not to be sustainable, most likely because of constraints in the labor supply and significant job cuts in the oil and gas sector (and industries that supply and service that sector).
It appears that the underlying trend in monthly job creation has settled back in to around 200,000. That’s more than enough to continue to drive the unemployment rate lower and maintain momentum in the economy. Unless the data deteriorates significantly further, it’s premature to think that the U.S. economy may be succumbing to problems emanating from China.

